
It has been a long time since I did this. About six weeks, apparently. Part of that has been that I was without real computer access for a loooooong three weeks. Part of that is that things got just a little bit chaotic around here for a while. In any case, the last real look at the numbers was February 20.
So, has anything changed?
Unless otherwise indicated, all stats are for 5v5 play and for players with at least 20 games. Data is from behindthenet.ca unless indicated and are per 60 minutes of ice time.
1. Basic stats:
Here’s where the Lightning season stands after game 37 against the New York Islanders (data is not yet available for game 38).
Fenwick close: 44.99 (26th)
Fenwick tied: 45.07 (27th)
BoltProspects’ Mike Gallimore has separated Fenwick and Corsi for Jon Cooper’s first five games, and there is some indication of improvement.
|
FenClose |
Corsi Close |
5v5 Fen |
5v5 Corsi |
|
|
Boucher |
43.0 |
43.2 |
45.8 |
46.3 |
|
Cooper |
49.0 |
47.8 |
47.9 |
48.4 |
|
Season to date |
44.1 |
44.0 |
46.2 |
46.7 |
I stress, though, that this is a very small sample, especially for Fenwick analysis. Each new game can move that number significantly if it is very much outside the average. Interesting, nonetheless.
Corsi On range: 1.16 (Steven Stamkos) to -14.48 (Tom Pyatt)
Relative Corsi range: 13.3 (Steven Stamkos) to -9.2 (Tom Pyatt)
Special Teams Efficiency: 17.5 + 82.5 =100.0
iPDO: 1063 (B.J. Crombeen) to 997 (Nate Thompson) (Brian Lee had a 946 in 22 games, but has been assigned to Syracuse.)
tPDO: 1024 (3rd)
QS (data from nhl.com and theahl.com):
NHL QS: above .912 SV% or .885-.912 w < 3 GA
AHL QS: above .907 SV% or .873-.907 w <3 GA
wasted QS: loss when a QS is posted
bail out: win when QS is not posted
- Anders Lindback: 10/18 starts (55.6%); 3 wasted; 4 bail outs
- Mathieu Garon: 7/15 starts (46.7%); 2 wasted (incl one where he was injured); 1 bail out
- Ben Bishop: TBL: 2/3 starts (66.7%); 1 wasted; 0 bailouts (Bishop had 8 QS in 12 starts with Ottawa: 66.7%)
- Cedrick Desjardins: TBL: 0/2 starts (0.00%); 0 bail outs; Syracuse: 6/8 (75%); 1 wasted; 1 bailout
- Riku Helenius: 16/30 (53.3%); 4 wasted; 3 bail outs
2. Score Effects and shots
You may have recently seen me reference a statistic called “Score-Adjusted Fenwick” and wondered what that was all about.
It’s essentially a way to include more events in your Fenwick analysis (and thus improve its predictive value) while still accounting for the fact that teams that are behind shoot more and teams that are ahead shoot less. As it’s author, Eric_T. of Broad Street Hockey put it: “if sample size is so important, doesn’t it seem inefficient to throw away all of the results from when the score isn’t tied?” It appears to do better than Fenwick Tied at predicting future performance, especially over smaller periods of time.
Basically, it gives us more information without all the noise of Fenwick Close (which is still subject to some level of score effects), and so its a better indication of what to expect going forward, especially early in a season when you don’t have as many games.
The Lightning’s Score-Adjusted Fenwick for (2012-)2013 is 46.98, 25th in the league as of April 7.
3. A brief screed on the ugliness of save percentage as a tool:
Advanced stats are limited in many regards. With them, we’ve found out a lot about offense, a little about defense, and almost nothing about goaltending. There has been no major advances in ways to evaluate goaltending since save percentage became common in the early 1980s.
But, much like Plus-Minus, save percentage is a very flawed metric. It appears to capture a great deal of noise, making it hard to get at what’s true goaltending talent and what’s just randomness. I am quite serious when I say that the signal of save percentages doesn’t really come through until a player has faced something like 4000 shots. That’s two to three years of full-time starting duty.
The kicker is that we don’t know where that noise is coming from. Thus, we don’t know how to correct for it. And all the stats we use to evaluate goaltenders, from Quality Starts to GVT to Goalie Point Shares are based on variation of a player’s save percentage from some kind of standard. Thus they don’t do much to solve the problem that is save percentage.
What this ends up meaning is that GMs have to evaluate goaltenders and make critical decisions before all the data is in. Fans often egregiously overvalue individual games or brief stretches as evidence that a goalie “has turned a corner” or “is in over his head.” There is no evidence that there’s a “hot hand” effect, despite players and fans wanting it to be there. It’s an apparent rather than real trend. And there’s no real connection between save percentages and winning records.
4. I’mma graph you up, baby.
Graphs are fun. Here are some:
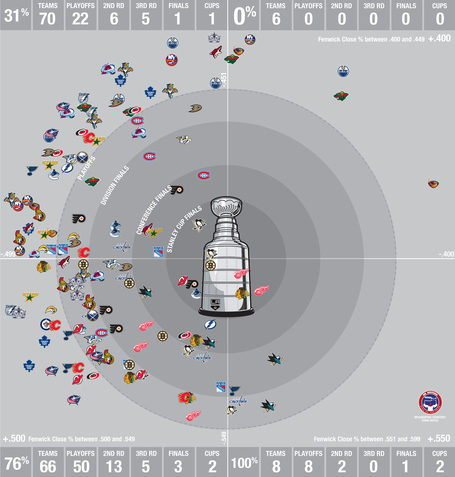
- This first graph from Chris Boyle at HabsEyesontheprize.com shows why I keep harping on Fenwick data/puck possession. It places every team’s possession numbers for the past 5 years in context with season outcome. It starts with under 40% at what would be 3 o’clock on a clock dial and rises as you move around the circle counter-clockwise. The closer you get to the center, the better the season outcome (non-playoffs, 1st round, etc.) Icons on the Cup are Cup winners. The real clincher here is the difference between playoff teams and non-playoff teams in terms of possession. Low possession means very low chance at a winning season. /

Notice how many non-playoff teams are in the upper-left quadrant. Then realize that the Lightning have spent much of this season at or below the .451 mark (at 12 o’clock)
- And I thought this was interesting. Rob Vollman of hockeybstract.com has developed a Player Usage chart that has the option to use either GVT (Goals Versus Threshold) or Corsi as a performance metric. [I tried to embed it, but it’s too large for this site.] Goals Versus Threshold is a measure of how many goals a player produces compared to what you’d expect from an average AHL call-up, not a star prospect. In other words, a Mike Angelidis rather than a Cory Conacher. You kind of have to compare forwards to forwards, defensemen to defensemen, and goalies to goalies when using GVT. Goalies always come out best in this metric, then forwards, and then defensemen.
